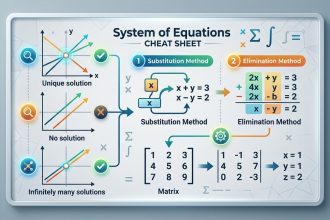
Picture two lines on a coordinate plane. One line climbs upward as it moves right. The other line cuts across at a steep angle. At some point, those two lines cross. That crossing point is the solution to a system of linear equations. For many students, this visual method is the most intuitive way to understand what it means to “solve” a system. Instead of manipulating symbols on paper, you get to see the answer right in front of you. Let’s walk through exactly how this works, step by step.
Solving systems of linear equations by graphing means plotting each equation on the same coordinate grid and finding the point where the lines intersect. This method works best when the intersection has whole-number coordinates. It gives you a visual check that other methods like substitution or elimination cannot match.
What Does Solving by Graphing Actually Mean?
When you hear “solve a system of linear equations,” you are really looking for one specific pair of numbers. That pair, an x-value and a y-value, must make both equations true at the same time. When you graph the equations, each equation becomes a straight line. The spot where the two lines meet is the only point that satisfies both equations. That is your solution.
Think of it like two friends walking on different paths. If their paths cross, they meet at one exact spot. That meeting point is the solution. If the paths never cross, there is no meeting. If the paths are exactly the same, they meet everywhere. These three cases cover every possible system of two linear equations.
The Step-by-Step Process for Solving by Graphing
Here is the exact process you should follow every time. Write these steps down and use them as a checklist.
-
Rewrite each equation in slope-intercept form (y = mx + b). This makes graphing much easier. If an equation is in standard form (Ax + By = C), solve for y first. For example, 2x + y = 4 becomes y = -2x + 4.
-
Identify the slope (m) and y-intercept (b) for each line. The slope tells you how the line moves. The y-intercept tells you where it crosses the y-axis. For y = -2x + 4, the slope is -2 and the y-intercept is 4.
-
Plot the y-intercept for the first equation. Start at (0, b) on the y-axis. Put a dot there.
-
Use the slope to find a second point. If the slope is -2, write it as -2/1. From the y-intercept, move down 2 units and right 1 unit. Put another dot. Draw the line through both points.
-
Repeat steps 3 and 4 for the second equation. Use a different color or line style if you can. This helps you tell the lines apart.
-
Look for the intersection point. Where do the two lines cross? Read the coordinates of that point. Write them as an ordered pair (x, y).
-
Check your answer. Plug the x and y values back into both original equations. If both equations are true, you have the correct solution.
A Worked Example You Can Follow Along With
Let’s solve this system by graphing:
y = 2x + 1
y = -x + 4
The first equation has slope 2 and y-intercept 1. Start at (0, 1). From there, go up 2 and right 1 to reach (1, 3). Draw the line.
The second equation has slope -1 and y-intercept 4. Start at (0, 4). From there, go down 1 and right 1 to reach (1, 3). Draw the line.
Notice something interesting. Both lines pass through the point (1, 3). That is the intersection. The solution is x = 1, y = 3.
Check it. Does 3 = 2(1) + 1? Yes, 3 = 3. Does 3 = -1 + 4? Yes, 3 = 3. The solution works.
What If the Intersection Is Not at Whole Numbers?
Graphing works best when the intersection lands on integers. Sometimes the lines cross at a point like (0.5, 1.75). Estimating from a graph can be tricky. In that case, you have two options.
First, you can use a more precise method like substitution or elimination. Second, you can graph very carefully on graph paper with a sharp pencil. If you are taking a test and the problem asks you to solve by graphing, the intersection will almost always have whole-number coordinates. Teachers know this limitation.
Three Possible Outcomes When You Graph a System
Not every system has one solution. Here is what you might see.
| Outcome | Graph Appearance | What It Means | Number of Solutions |
|---|---|---|---|
| One solution | Two lines crossing at one point | The lines have different slopes | Exactly one |
| No solution | Two parallel lines | The lines have the same slope but different y-intercepts | Zero |
| Infinite solutions | One line on top of the other | The lines have the same slope and same y-intercept | Infinitely many |
If you see parallel lines, stop. There is no point that satisfies both equations. If you see lines that line up perfectly, every point on the line is a solution.
Common Mistakes Students Make
Even with a visual method, mistakes happen. Here are the most frequent errors and how to avoid them.
- Mixing up the slope direction. A negative slope means the line goes down as you move right. A positive slope goes up. Double check before you draw.
- Forgetting to rewrite the equation. If you graph an equation in standard form without converting to slope-intercept form, you might misplace the intercept.
- Drawing lines too thick. Use a sharp pencil. Thick lines make it hard to tell where the intersection actually is.
- Reading the wrong point. After you find the intersection, read the x-coordinate from the horizontal axis and the y-coordinate from the vertical axis. Swap them by accident and your answer is wrong.
- Not checking the solution. A graph can be misleading if you drew it slightly off. Always plug the coordinates back into the original equations.
Expert advice from a veteran algebra teacher: “The single best habit you can build is checking your answer. It takes 15 seconds and catches 90 percent of graphing mistakes. Do not skip it.”
When Should You Use Graphing Over Other Methods?
Graphing is not always the fastest method. But it has strengths that other methods lack.
Use graphing when:
- You need a visual understanding of the problem.
- The equations are already in slope-intercept form.
- You expect the solution to have whole numbers.
- You want to double-check an answer you got from substitution or elimination.
- The problem specifically says “solve by graphing.”
Skip graphing when:
- The equations have fractions or decimals as coefficients.
- You need an exact answer and the intersection looks like it might be fractional.
- You are short on time and the system is complex.
For a deeper look at other methods, check out The Ultimate Cheat Sheet for Solving Systems of Equations.
How to Improve Your Graphing Accuracy
You do not need fancy software to graph well. A few small changes make a big difference.
- Use graph paper. Lined paper is not precise enough.
- Label your axes. Write x and y so you do not get confused.
- Number your tick marks. Every fifth line is a good spacing.
- Draw arrows on the ends of your lines. This reminds you that lines extend forever.
- Use a ruler. Freehand lines wander and cause errors.
- Extend your lines past the intersection. This confirms that they actually cross and do not just appear to cross.
Connecting Graphing to Real Life
Linear systems show up more often than you might think. Here are a few examples.
A small business owner compares two pricing plans. Plan A charges a flat fee of $50 plus $10 per hour. Plan B charges $20 per hour with no flat fee. Graphing both equations shows the break-even point where both plans cost the same. That intersection tells the owner how many hours of service make Plan B the better deal.
A student compares two cell phone plans. One plan has a lower monthly cost but higher per-minute charges. The other has a higher monthly cost but lower per-minute charges. The intersection point shows how many minutes of talk time make the plans equal.
These real-world problems are exactly the kind you will see on standardized tests. If you need help converting word problems into equations, read our guide on Converting Word Problems Into Equations: A Step-by-Step System for Standardized Tests.
A Summary of Key Points
Before you move on, here is a bulleted list of the most important ideas to remember.
- Every linear equation graphs as a straight line.
- The solution is the point where the lines cross.
- Rewrite equations in y = mx + b form before graphing.
- Use the y-intercept and slope to plot points.
- Check your solution by plugging it back into the original equations.
- Parallel lines mean no solution. Identical lines mean infinite solutions.
- Graphing is visual and intuitive but less precise for fractional answers.
Troubleshooting When Your Graph Looks Wrong
Sometimes you graph both lines and something feels off. The lines might look parallel when they should cross. Or the intersection point does not make sense when you check it.
First, check your algebra. Did you solve for y correctly? A sign error in the slope changes everything. Second, check your plotting. Did you start at the correct y-intercept? Did you move in the right direction for the slope? Third, check your scale. If you skipped numbers on the axes, your graph might be distorted.
If you still cannot find the error, try graphing each equation separately on scratch paper. Sometimes starting fresh reveals a mistake you missed.
Building Confidence With Practice
The more you practice solving systems of linear equations by graphing, the faster you get. Start with simple systems where both equations are already in slope-intercept form. Work your way up to systems that require rewriting. Eventually, try systems where the intersection is at a fraction and see how close your graph comes.
If you find algebra mistakes creeping in, take a look at 10 Common Algebra Mistakes and How to Avoid Them. Many graphing errors actually start with algebra errors.
Your Turn to Graph
Solving systems of linear equations by graphing is a skill you build through repetition. Each time you plot a line, you strengthen your understanding of slope, intercepts, and the relationship between equations and their graphs. The method may not be the fastest, but it is the most visual. And for many students, seeing the solution makes everything click.
Grab some graph paper, pick a system, and start plotting. The intersection point is waiting for you to find it.